Module 2: Group 5 – Will Ames & Cole Kirschner

Open Cluster: NGC 3114

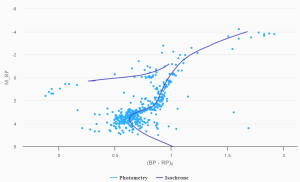
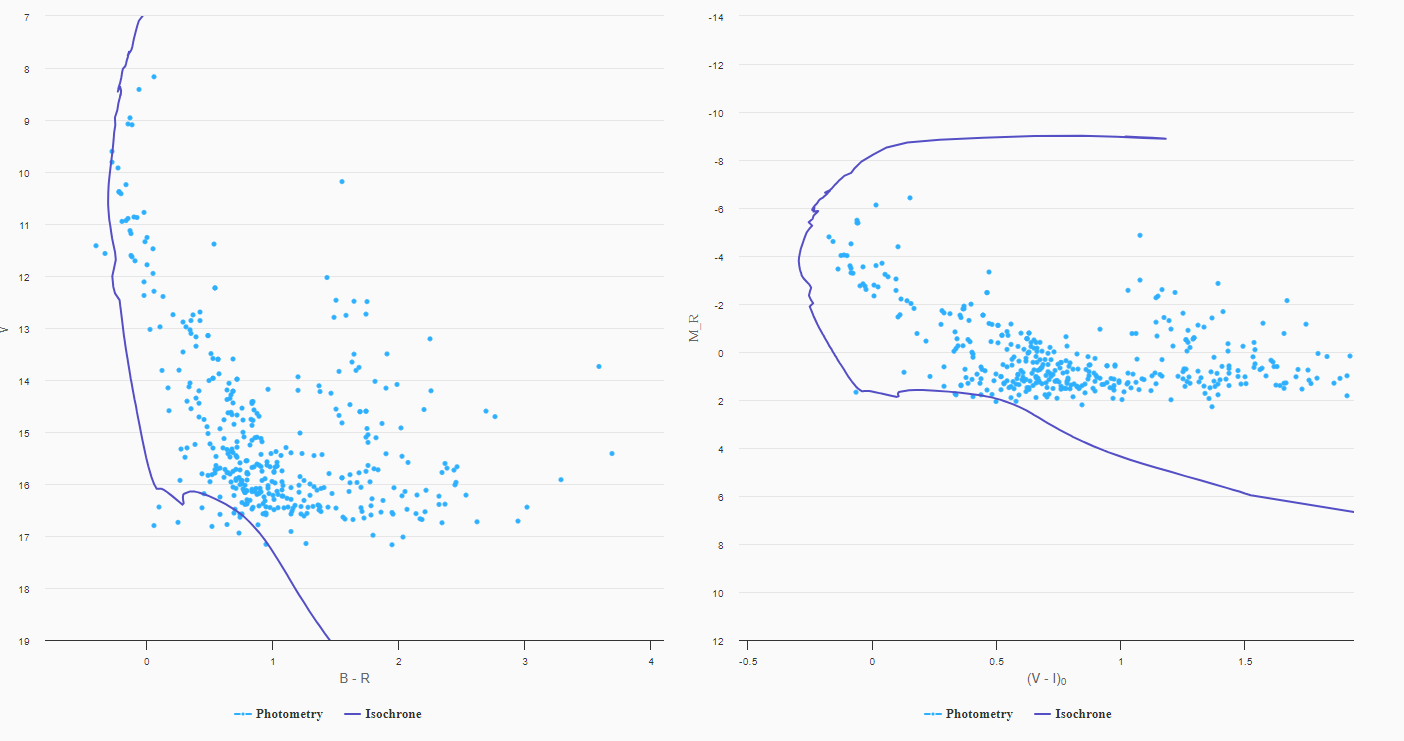
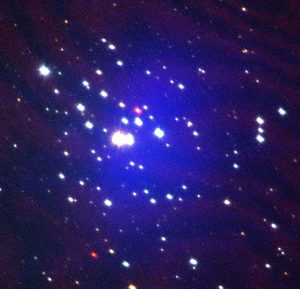
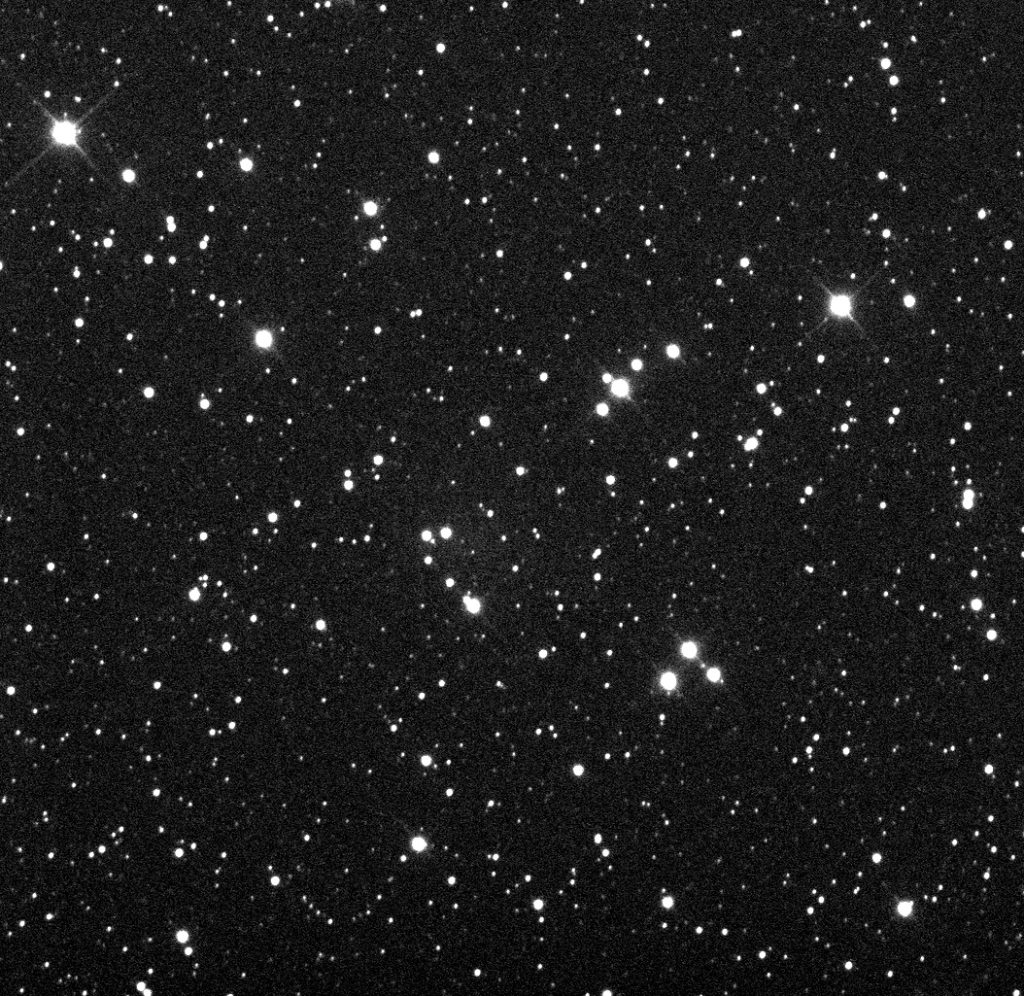
This observation of the Open Cluster NGC 3114 was taken with a Prompt 5 telescope in La Serena Chile. We used filters B, V, R, and I. The exposure for B was set to 30.0s, V was 20.0s, R was 10.0s, and I was 15.0s. The total observing time per filter was 75 seconds.  We utilized “batch” photometry to measure the brightness of each star in our cluster. The zero-point calibration would not cooperate so the “grey image” was the best for observations. After getting the picture to look as clear as possible we uploaded the photometry data to astromancer. Astromancer very conveniently portrayed beautiful graphs and gave us useful information after playing around with it. We found an age of 6.85log(yrs), a metallicity of -0.15 (solar), and an E(B-V) reddening value of 0.08.

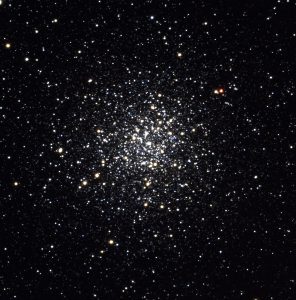
Globular Cluster: NGC 1851 
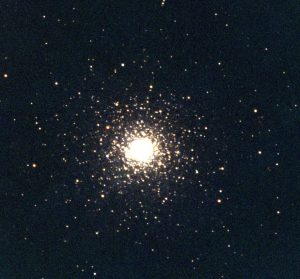
 

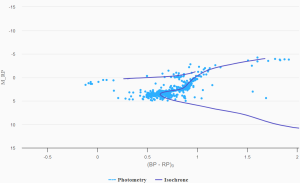
These observations were taken with B,V,R, & I filters. Half of these observations were taken with the Prompt-MO-1 telescope in Australia, and the other half of the observations were taken with the Prompt 5 telescope in La Serena, Chile. The observations from Prompt 5 were much more clear and detailed. This is due to a combination of weather conditions and the higher altitude of the telescope. The exposure of these observations ranged from 7-18 seconds. The use of batched photometry allowed an algorithim to measure the brightness of light sources in arbitrary units, and with this information we’re able to filter out many of the field stars by magnitude, distance, and luminocity.

With this information we’re able to find data and our sources were within 10-20% of the stated one:

Distance: 11.54 (kpc)
Log Age: 10.2 log(yrs)
Age: 15848.93 (Myrs)
Metallicity: -1.65 (solar)
Reddening: 0.07 (mag)
Posted in Module II | Comments Off on Module 2: Group 5 – Will Ames & Cole Kirschner

Module 2 – Group 2 – Joshua Ferreira & Jeremy Wehking

In this module, we first took pictures of the open star cluster, NGC 2070 using optical imaging. We did this by using Skynet and the La Serena telescope in Chile. We used the filters B, V, R, and I. We set the exposure duration to 30 seconds for the filter B, 20 seconds for the filter V, 10 seconds for the filter R, and 15 seconds for the filter I. Later, we received the images. Then, we processed the images using Afterglow.

We also took pictures of the globular star cluster, NGC 3201, using optical imaging. We did this by also using Skynet and the La Serena telescope in Chile. We used the filters gprime, rprime, and iprime. We set the exposure duration for each of these filters to 60 seconds. Later, we received the images. Then, we processed the images using Afterglow.

For both NGC 2070 and NGC 3201, we stacked and aligned the images. Then, we added color to the stacked image. We then used the photometry tool in Afterglow to measure the brightness of each star. Next, we used Clustermancer and uploaded our photometry data. Clustermancer then put all of the stars on a graph. Finally, we adjusted the age, metallicity, and reddening to make our data fit the isochrone model.

Posted in Uncategorized | Comments Off on Module 2 – Group 2 – Joshua Ferreira & Jeremy Wehking

Module 2: Jack Glassner and Bradley Armour

For this module we observed the star cluster Messier 44 aka the beehive cluster. This was done using the H-SC telescope and filters B,V,R, and I. The B,V, and R filters were used to best match the wavelength response of the human eye, while I filter provided a redder wavelength to better model the cluster’s age and metallicity. Once checking on our images we processed them using afterglow. The processing began with aligning and stacking our images. From there we used afterglows photometry tools. Using catalog we calibrated the zero point offset of each image in the stack. Once the zero points were identified we plugged them in to calibrate the colors that corresponded with each filter.

The second step of our lab was data analysis. Using clustermancer we uploaded the photometry data from afterglow. Doing so clustermancer placed all of the stars identified in our cluster on to a graph. On the x axis of the graph was the objects magnitude in a in a bluer filter for shorter wavelengths and its magnitude in a redder filter for longer wavelengths. On the y axis we was the objects brightness. From there we began to match the an Isochrone model to our data. This was done by adjusting the age and metallically sliders til the line oun our graph match the data of our stars. Ultimately we landed on log(age) = 8.75log(yr) and Metallicity: 0 solar.


Posted in Module II | Comments Off on Module 2: Jack Glassner and Bradley Armour

Module 1 – Group 3 – Joseph Corrigan & Jeremy Wehking

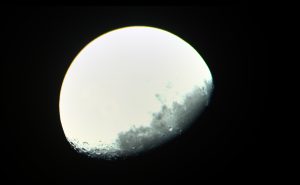
We first took pictures of the moon using optical imaging. We did this by using Skynet and the HSC telescope. We used the filters U, Halpha, and OIII and we set the exposure duration to 0.03 seconds. Later, we received the image. Then, we processed the image using Afterglow.

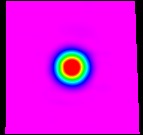
We then took pictures of the moon using a radio telescope. We also used Skynet, however, we used the Cerro Tololo Inter-American Observatory telescope instead of the HSC telescope. We used the filter HI(1355.0-1435.0) and the center frequency of 1395 MHz. We changed the gap between sweeps to be 1/5 Beam Width. For the map depth, we changed the integration time to 0.501 seconds and the slew speed to 0.3 degrees/second. Later, we received the image. Then, we processed the image using Skynet.


Posted in Uncategorized | Comments Off on Module 1 – Group 3 – Joseph Corrigan & Jeremy Wehking

Module 1 Group 2

Radio Observation of Crab

I submitted 200 pictures of the moon. I submitted them in Halpha, OIII, SIII. I aligned the photos and then stacked them. I had some bad pictures so my final optical observation did not come out great. I tried to play around with the filters and the stacking but it didn’t change much so that is the best picture I have.


The radiological observations I took were of the moon and crab. I followed the worksheet for how to make the observation. I used the flux calculations and enter them in to the worksheet below. The radiological observations were harder at first but once you were able to do the calculations it became much easier.

The worksheet below contains all of my calculations .


Module 1B Template.xlsx

Radio Observation of the moon

Optical Observation of the moon

Posted in Module I | Comments Off on Module 1 Group 2

Group 5 – Module 1: Observing the Moon and Planets

We observed the Moon using the HSC telescope. This process began by setting our min target elevation to 30 and min visible hours to 0.75 so as to get a clear view of the moon. From there we selected filters U, Halpha, and OII at a number of 25 exposures for 0.125 seconds. Once the images returned we moved them over to afterglow for further edits. We began with cosmetic correction to clear out any bad pixels. There was no need to align our images because of the wide lens on the HSC telescope. From here we moved on to stacking the images from the 3 different filters. Then we toyed around with the brightness and contrast settings. Stretch mode was set to midtone where we applied different midtone level percentiles to the different filters to get them to match up in the stacked image. This process generated the image above.

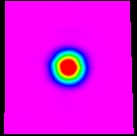
Here we observed the moons radio wavelengths again using the HSC telescope. We began the process of calculating the moons temperature by using the photometry tool in afterglow. We calculated the flux density to be 3988 units when the moon was half full and 4701 units when the moon was full. For our calibration images we used Cyg G which had a flux density of 4312 units when the moon as half full and 4135 units when the moon was half full. From here we used an arbitrary ratio to compare the two. Using Skynet we were able find our jansky units to be 851.1 and 851 jy. Using the ratio between the two we multiplied it by the jansky of the calibration images which resulted in 802 and 975 janskys. From here we needed to determine how far away the moon was. Ultimatley it was determined that the moon was 384000 km and 40400 km on the dates observed. Using the Raleigh-Jeans limit 231 K when full and 251 K when half full. It is odd that we calculated the moon to be brighter when half full, this could be due to errors in calculation.

Posted in Module I | Comments Off on Group 5 – Module 1: Observing the Moon and Planets

Module 1-B Group 1 – Abram Rodriguez & Will Ames

Radio Image of the Moon, Full

Abram J. Rodriguez, William Ames

Temperature of an Object Using Flux Density

We decided to do radio images of the moon and Tau A as our calibration image in order to find the temperature of the moon when it was half full, as well as when the moon was full.

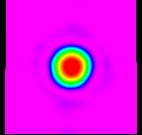
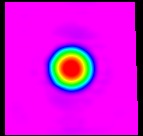
In order to find the temperature of the moon we used a photometry tool in afterglow to find the flux density of it. We found the flux density of the moon to be 4697 units when it was half full and 3991 units when it was full. We followed the same process for our calibration images and around the time the moon was half full, Tau A had a flux density of 4121 units. When the moon was full, tau a had a flux density of 4292.

We got an arbitrary ratio when we compared each value to its respective date. In order to find the Jansky value we had to use Skynet to find the Jansky units at the time they were taken. They were 847 and 847.1 jy respectively with their dates. Using the ratio we found between the two objects before we simply times it by the janskys that the calibration images had to get 960 and 787 janskys respectively for the moon.

Once we had our jansky values, we archived how far the moon was on their respective dates in order to find their temperature, interestingly using the Apple proprietary weather app. We found that the moon was 384000 km and 40400 km respectively on their respective dates. We had some other values that were already given to us and we used Raleigh-Jeans limit to find that the moon was 248 K when it was half full and 227 K when it was full.

We are not sure why we got a lower temperature value for when the moon is full because it is experiencing more direct light. Our data is posted here: Module 1B data


Posted in Module I | Comments Off on Module 1-B Group 1 – Abram Rodriguez & Will Ames

Module 1-A Group 1 – Will Ames & Abram Rodriguez

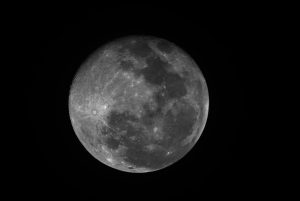
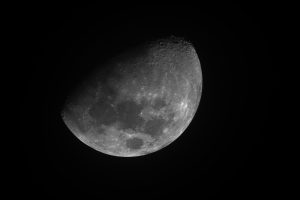
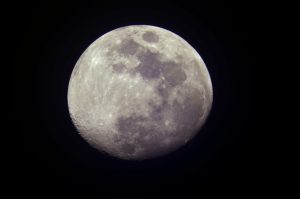
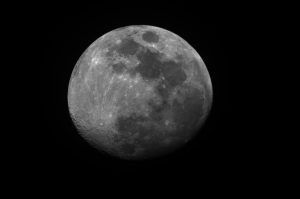
My partner and I enjoyed messing around and tweaking our observations on Skynet. There were definitively some challenges, but we were able to work through them by getting lots of observations early on in the week. The images were taken a little before the moon was full due to weather conditions, but the observations we got were much better than nothing. If we had a full week of clear skies we would’ve been able to improve the final product just a bit more.

I believe the final product looks good, but there was a little bit of distortion when all the images were grouped together. For some reason the grouped image seems to have a little less detail than they did individually. This could be do to the colorization process, or to the aligning process despite them being taken at similar times.

Overall we’re very happy with how our final product turned out. Other than a bit of detail, there isn’t much of a difference between our image and other images of the colorized moon we have seen on the internet. The colorized image of the moon is helpful for distinguishing lunar maria between lunar highlands.

Upload onto this blog also diminished the image quality. Greyscale image has also been included for reference.

– Moon colorized

– Moon greyscale (Halpha filter)

Posted in Module I | Comments Off on Module 1-A Group 1 – Will Ames & Abram Rodriguez

Home

This website contains the work of students taking Astronomy 210: Observational Astronomy at Hampden-Sydney College. In this class, we use the Hampden-Sydney Observatory, other telescopes on the Skynet network, as well as radio telescopes at the Green Bank Observatory. This course follows a unique curriculum called Astrophotography of the Multi-Wavelength Universe, or MWU! for short, which is being developed by astronomy professors around North America, including the instructor of this class. The MWU! project is funded by a $3M DoD National Defense Education Program (NDEP) award. The very best student work from various colleges and universities is also published at the MWU! Blog of Blogs.
Posted in Uncategorized | Leave a comment